
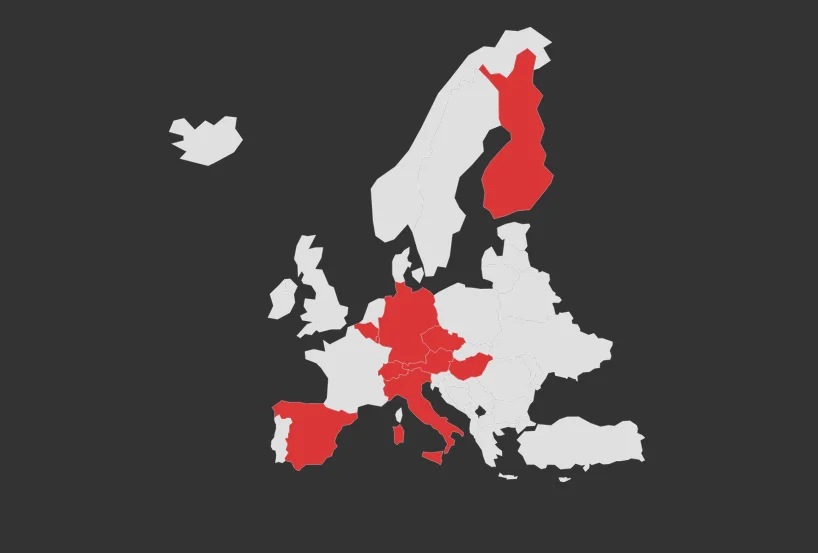
This is a step-by-step tutorial whose goal is to recreate an identical WordPress plugin: an interactive Europe map based on D3, with an admin panel for selecting countries, “Number of projects” and “Project value” fields, a tooltip toggle, optional background (color picker), and multilingual readiness. I walk through the process from zero to the final result, and at the end I provide the full 1:1 code for all files so they can be copied without guesswork and a working version can be launched immediately.
Why a plugin instead of code in the theme?
Instead of putting everything in the theme’s functions.php, I chose a separate plugin. This gives me several benefits. First, business logic and interactivity are separated from the theme’s appearance. Second, I can change the theme and still keep the map working. Third, it is easier to maintain order when I know the whole feature lives in one place. And one more thing: if I build something for a client or a marketing team, a plugin is simply more predictable and easier to hand over. It saves time and nerves. 🙂
Project assumptions
At the beginning I wrote down functional requirements. The map should display European countries, selected countries should be highlighted with color, and per-country data should contain the number of projects and project value. In the admin panel, I wanted a list of countries with a checkbox and text/number fields. In addition, I needed an option for whether the tooltip should be visible on hover. Then the background topic appeared: ideally transparent, but with the option to set a color via color picker. Finally, an important point: multilingual preparation, meaning every string wrapped in WordPress translation functions. This way localization will not become a headache later.
File structure I used
I chose a simple structure: the main plugin file dc-d3geo.php, an assets/css folder for styles, and an assets/js folder for front-end and admin scripts. This split is readable and not overcomplicated. I did not build a framework inside a framework. It should work, be understandable, and be quick to modify. If someone from the team takes over the code, they immediately know where to look: admin in PHP, map in JS, appearance in CSS. In many projects, this kind of organization makes a bigger difference than fancy architectures.
Step 1: plugin header and main class
In the main file I added the standard WordPress header: name, description, version, author, and Text Domain. Then I created a class that registers hooks. This gives me one place where I control the flow: loading translations, menu in admin, settings registration, file enqueueing, shortcode. Such a class does not have to be complicated. The most important thing is that it has well-named methods and a predictable lifecycle. For security, I also added the classic if (!defined('ABSPATH')) exit; so the file cannot be run directly via URL.
Step 2: administrator panel
I needed my own settings page, so I used add_menu_page(). I gave it a sensible slug and a Dashicons icon. Then I added register_setting() with a sanitization method. Sanitization is an absolute must-have. Even if it is “admin only,” data still has to be cleaned. I convert checkbox values to 0/1, the project number with absint(), and project value with sanitize_text_field(). For background color I used sanitize_hex_color(). Thanks to this, the panel is more resistant to accidental junk and it is easier to keep data consistent.
Step 3: Europe country catalog
Instead of entering countries in several places, I made one method that returns a country catalog (ISO2 code + name). This simplifies everything. When I render the table in admin, I iterate over this catalog. When I generate data for JS, I iterate over the same source. There is no duplication, so there is a smaller risk of mismatch. Additionally, I wrapped country names in the __() function so they are ready for translation right away. This step seems boring, but this is exactly what creates order in the long term.
Step 4: settings form (checkbox + numbers + value + color picker)
In the form I added the “Show tooltip on hover” section, and below it a map background color field. For the color picker I used the native WordPress mechanism: wp-color-picker. You need to enqueue style and script and initialize the field via a small admin JS file. Next to the country table I added columns: active, country, number of projects, project value. Thanks to this, a non-technical person can manage the map without touching code. And that was exactly the point. Admin panel UX is just as important as a nice front end.
Step 5: shortcode and correct asset loading
I embed the map with the [dc_d3geo_map] shortcode. This is convenient because I can insert it into content, a widget, or a template via do_shortcode(). An important lesson I learned: you cannot rely only on a flag set during shortcode rendering if assets are loaded earlier on wp_enqueue_scripts. In my case this caused missing CSS/JS in some templates. I finally solved it by calling front enqueue directly during shortcode rendering. Thanks to this, the shortcode always has everything it needs.
Step 6: D3 + TopoJSON map front end
On the front end I load D3 and TopoJSON from CDN and my own front.js script. I pass data from PHP through wp_localize_script: country activity, project numbers, values, and tooltip setting. In JS I fetch world TopoJSON and filter only European countries by centroid. Then I draw SVG paths and assign the active class to countries selected in admin. Thanks to this, coloring is trivial: CSS does the rest. Performance is very good because geographic data is lightweight, and the map itself is pure SVG without heavy UI libraries.
Step 7: tooltip as an ON/OFF option
The tooltip is a detail that creates a “wow” effect, but it is not always desired. That is why I added a switch in admin. If tooltip is disabled, JS simply does not show the tooltip layer and does not run unnecessary rendering logic. If enabled, on mouseenter I set country name, flag, and metrics, and on mousemove I update position. You must be careful so the tooltip does not go outside the viewport, so I added a simple edge position correction. The effect is smooth, and the code stays simple.
Step 8: removing “weird islands” (Norway and France)
In world maps, territories often appear that formally belong to a country but visually break the Europe frame. This happened to me with Norway (far north islands) and France (territory far to the south). I solved it by filtering MultiPolygon parts per country. For Norway, I remove parts with centroid above a defined latitude. For France, I keep only metropolitan France (plus Corsica). Thanks to this, the map looks “normal” for a business audience and does not distract with unnecessary objects.
Step 9: map background — transparent or configurable
At one point, a need appeared for the map to be “without background.” That is a great idea, because it is easier to embed in different page sections. So I set no default background in CSS, and in admin I added an optional color. If the color field is empty, the map is transparent. If the administrator chooses a color, background-color appears inline in the wrapper. This is a simple mechanism, but it provides full control without involving a developer. And these small decisions significantly improve project usability. 🎨
Step 10: multilingual readiness
I wrapped every user-facing text with translation functions: __(), esc_html__(), esc_attr__(). I also set the Text Domain and translation loading via load_plugin_textdomain(). Thanks to this, I can later generate a .pot file and prepare translations for any language. This saves a lot of work when a website moves to English, German, or Spanish. If someone creates a plugin “for now,” they often skip i18n. I prefer doing it correctly from the beginning, because then each additional language is just a simple formality.
Step 11: security and data sanity
Even in small plugins, I follow basic rules: I check user permissions when rendering the admin panel (manage_options), sanitize data on save, escape data on output, and in JS I do not assume a global object always exists. These are not “fireworks,” but they are what protect the project from stupid errors and time loss. In addition, I keep default option values so the plugin behaves reasonably right after activation. Thanks to this, I do not have to explain to a client why “nothing works at the beginning.”
Step 12: practical testing
After each change, I ran a quick checklist: does the panel save, do country checkboxes work, does tooltip respect ON/OFF setting, does the map render via do_shortcode() in a template, does background work as transparent and as a color. Then I did a hard refresh (Ctrl+F5) to exclude browser cache. I also tested the “zero active countries” scenario, because such edge cases appear only in production. It is only a few extra minutes, but it saves hours of support after deployment.
Most common pitfalls I encountered
The biggest pitfall is asset loading timing relative to shortcode rendering. The second pitfall is geography: world maps almost always have edge cases that must be manually adjusted to business context. The third is postponing i18n “for later” — later usually means “too expensive” or “not enough time.” The fourth is an overly complicated admin panel. The simpler it is, the fewer user errors. The fifth is missing sanitization, which sooner or later will bounce back. Good practices are boring, but they really work. ✅
Full plugin code
Below is the complete code of all files needed to run an identical plugin. First create the plugin folder, then paste the code exactly into the corresponding files.
Directory structure
dc_d3geo/
├── dc-d3geo.php
└── assets/
    ├── css/
    │   ├── admin.css
    │   └── front.css
    └── js/
        ├── admin.js
        └── front.js
File: dc-d3geo.php
File: assets/js/front.js
File: assets/js/admin.js
File: assets/css/front.css
File: assets/css/admin.css
How to run the code after pasting
- Copy the
dc_d3geofolder towp-content/plugins/. - Activate the plugin in the WordPress panel.
- Go to the Europe Map menu and configure countries/data.
- Insert the
[dc_d3geo_map]shortcode in content or a template. - Do a hard refresh (
Ctrl+F5) if you use cache.
How I would expand it in version 2.0
If I developed this plugin further, I would add a few more features. First, settings export/import to JSON, so configuration can be easily moved between environments. Second, an option to set active country color and hover color directly from admin. Third, more metrics in tooltip (for example project category). Fourth, geographic data caching on the server side if someone does not want to rely on CDN. Fifth, .pot file generation and release automation. These are natural evolution steps.
My real deployment workflow (dev → staging → production)
In practice I pay close attention to deployment order. First I test functionality locally: does the plugin activate without errors, does the settings panel save values, does the shortcode render the map in different theme locations. Then I move changes to staging and test the same things on production-like data. This is where differences usually appear: different cache policy, different plugin set, sometimes older PHP version. Only after this round do I go to production. This process may seem formal, but thanks to it I do not fight fires after release. 🔥
Additionally, I keep a simple post-deployment checklist: does the map load on desktop and mobile, does the tooltip avoid covering key elements, do colors have sufficient contrast, do translations work after switching site language, and is settings save blocked by any security extension. If the client has very aggressive cache, I always plan cache clear after deployment and a short live test window. These are small steps, but they make the difference between a nervous deployment and a calm one.
It is also worth remembering team documentation. I usually leave a short instruction: where the panel is, how to select countries, how to disable tooltip, how to set transparent background, and what to do if the map does not refresh (usually hard refresh + cache purge). Thanks to this, the site owner does not need to come back to the developer with basic questions. And I can focus on further improvements instead of repeating the same instructions. For me this is an important part of project quality, although often underestimated.
Summary
This project confirmed for me that a good WordPress plugin is not magic, but a series of conscious decisions: a simple admin panel, solid sanitization, sensible asset loading, i18n from the beginning, and practical map adjustments for real use case. Thanks to this, I have a solution that looks good, works reliably, and is easy in daily use. Most importantly: the person managing content does not need to ask a developer for every small change. And that is real business value. If you are doing a similar project, start with a small core and iterate calmly. Good things are built in layers. 🚀
FAQ: questions I hear most often
Do I need to know D3 to build this kind of map?
I do not need to be an expert. Basic understanding is enough: how to load data, draw SVG paths, and add events. The rest can be developed step by step. D3 is huge, but in this case I use only a small subset of its API.
Can this be done without external CDNs?
Yes. I can keep libraries locally in the plugin. In practice CDN is convenient, but not always compliant with project policy. If full control is the priority, local assets are the safer option.
Does this map put load on the site?
With a reasonable implementation, no. It is mostly SVG and a few events. The most important thing is not to overdo heavy animations and to limit processed data to what is actually needed.
Is this plugin suitable for multisite?
Yes, but you need to consciously decide whether settings should be per-site or global. In my version, settings are per-site by default. For global options, a different storage strategy can be used.
What is the most important tip at the end?
Do not overcomplicate at the start. First a working MVP, then iterations. It is better to have a simple, stable version 1.0 than an “ideal” project that never reaches production. 👍