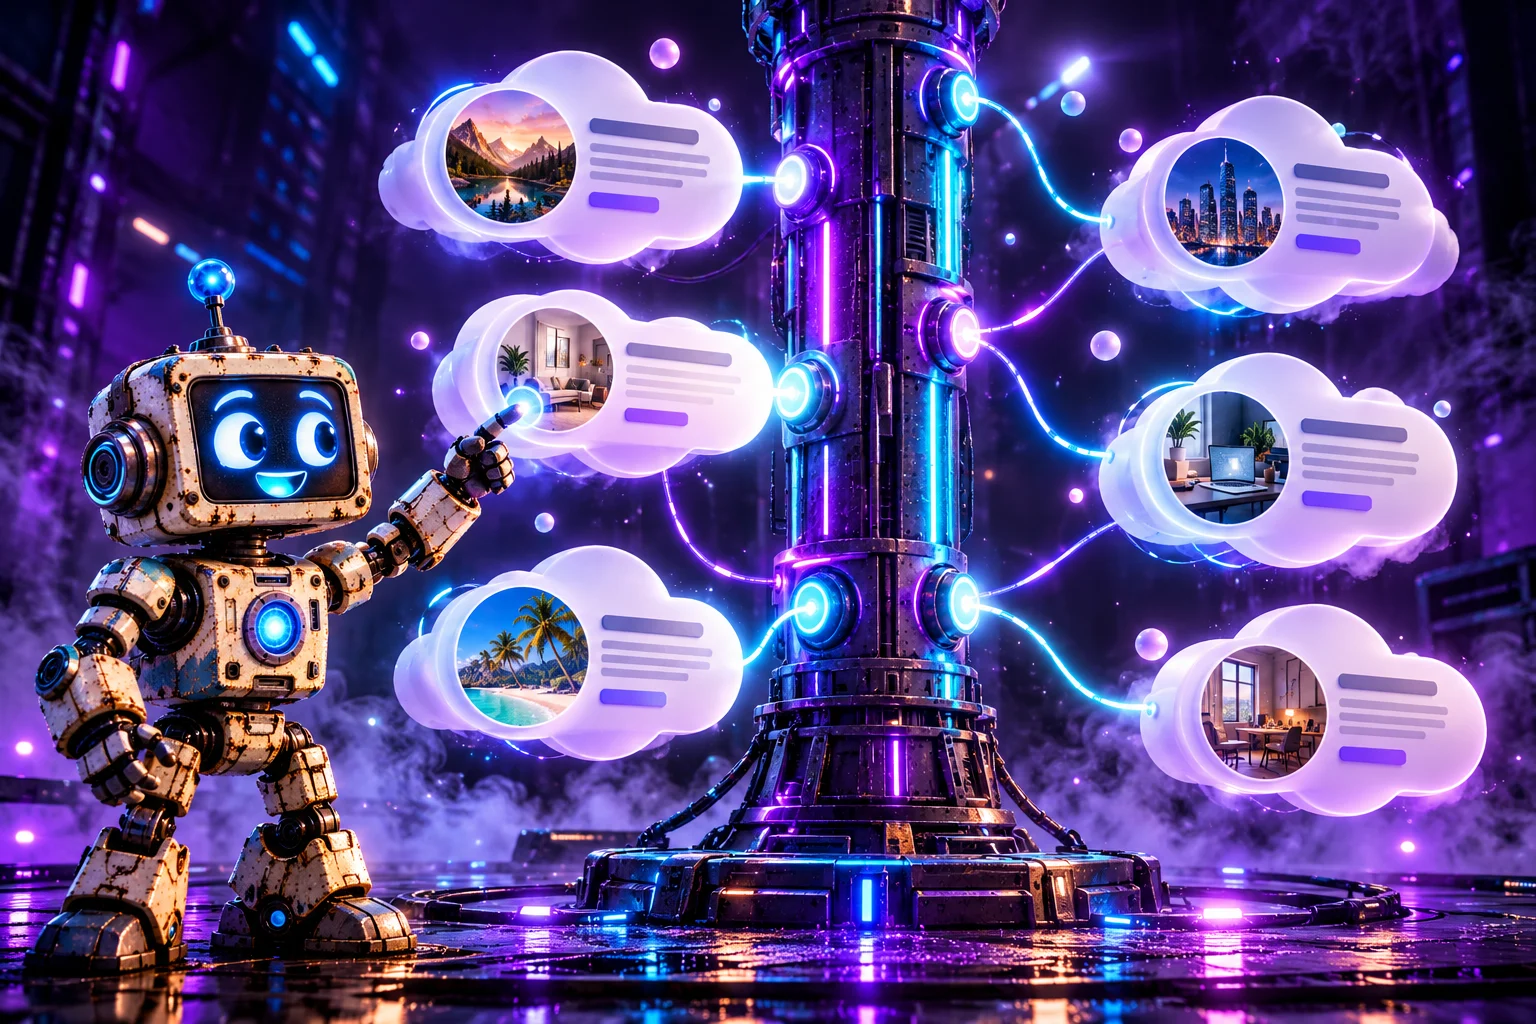
I added the option to switch the entire layout between vertical and horizontal orientations. I also built a settings panel for changing colors, wave height and speed, the amount of cloud drift, and event photos. The entire effect runs on plain HTML, CSS, and JavaScript, without Three.js, GSAP, jQuery, or a dedicated timeline library. The demo's only external resource is the Nunito font loaded from Google Fonts; the timeline engine itself needs no third-party scripts.
In this tutorial, I'll break down my code step by step. I'll explain how I generate irregular card outlines, calculate event coordinates, construct animated SVG paths, and keep the connectors attached to moving elements. I won't reproduce the enormous Base64 strings containing the sample images — instead, I'll explain their purpose and show where to insert your own pictures.

1. What Exactly Did I Build?
The centerpiece is a timeline containing six sample milestones, beginning with the first idea in January 2023 and ending with plans labeled “2025 and beyond.” I created this fictional story to demonstrate how the component works; it isn't an actual company's historical record.
Every event gets a numbered marker on the main axis, its own card with a title, date, description, and circular photo, and a thin line connecting the card to its timeline marker. These connectors aren't straight lines. I calculate their shapes with sine functions, making them look like flexible cables gently moving through space.
I implemented two layouts. In the vertical layout, the timeline runs down the center of the screen, with cards alternating on either side. On narrow screens, I shift the axis to the left and move all cards to its right. In the horizontal layout, the axis crosses the middle of a wide scene, with cards appearing alternately above and below it. If there isn't enough room, visitors can scroll horizontally.
This isn't a GIF or a prerecorded video. The cards are real HTML elements, the connectors are SVG paths, and JavaScript updates their coordinates in real time.
2. Project Architecture: Three Technologies, Three Roles
I decided not to force every responsibility into one graphics technology. Instead, I let each part of the web platform do what it handles best:
- HTML provides the scene containers, settings panel, and hidden file input.
- CSS controls colors, the axis gradient, cloud shapes, images, and interface styling.
- SVG draws the wavy connectors and small endpoint circles.
- JavaScript generates the cards, measures their dimensions, calculates the layout, and animates the scene.
I put the entire demo into a single Timeline.html file. That makes the effect easy to test and share. When integrating it into a CMS, I can of course move the styles, content data, and logic into separate files.
3. HTML Structure: The Scene, Timeline Axis, and Options Panel
I started with a small HTML skeleton. The most important element is #wrap, which contains #stage. Inside that stage are #bar, the central timeline axis, and svg#lines, where I later insert the connectors.
<h1>Our Story</h1>
<div class="sub">Find the appearance options in the ⚙ panel in the top-right corner</div>

<div id="panel">
  <header id="ph"><span>⚙ Options</span><span id="chev">▾</span></header>
  <div class="body">
    <div class="seg" id="seg"><button data-o="v" class="on">Vertical</button><button data-o="h">Horizontal</button></div>
    <div id="colors" style="display:grid;gap:9px"></div>
    <div class="row"><span>Wave height</span><input type="range" id="amp" min="0" max="24" value="7"></div>
    <div class="row"><span>Wave speed</span><input type="range" id="speed" min="0" max="3" step="0.1" value="1"></div>
    <div class="row"><span>Cloud drift</span><input type="range" id="drift" min="0" max="30" value="10"></div>
    <button id="shuf">🎲 Shuffle clouds</button>
    <button id="reset">Reset colors</button>
  </div>
</div>

<div id="wrap"><div id="stage"><div id="bar"></div><svg id="lines"></svg></div></div>
<input type="file" id="file" accept="image/*" hidden>
The event cards and numbered markers aren't hard-coded into the HTML. I create them in render() from an array of data, so the number of events isn't tied to a fixed number of manually written elements.
I also included a hidden input[type="file"]. Clicking an event photo opens it, allowing me to replace the image without leaving the page. This is a local change held in the current page session, not a file upload to a server.
4. CSS Variables: Seven Colors Control the Appearance
Rather than repeating specific colors across individual selectors, I defined seven CSS custom properties. The customization panel updates these values later.
:root{
  color-scheme:dark;
  --bg:#12142b;--bar1:#7c5cff;--bar2:#18d6c8;--line:#9aa4ff;--card:#ffffff;--text:#1d2040;--accent:#6a49f0;
  box-sizing:border-box;padding-top:env(safe-area-inset-top,0px);padding-bottom:env(safe-area-inset-bottom,0px);
--bg sets the page background; --bar1 and --bar2 determine the beginning and end of the axis gradient; --line controls connector color; --card and --text control the cards; and --accent defines the highlights, photo borders, and date color.
In JavaScript, I represented the same defaults in DEF and defined labels for the controls:
const DEF={bg:'#12142b',bar1:'#7c5cff',bar2:'#18d6c8',line:'#9aa4ff',card:'#ffffff',text:'#1d2040',accent:'#6a49f0'};
const LABELS=[['bg','Background'],['bar1','Bar — start'],['bar2','Bar — end'],['line','Lines'],['card','Clouds'],['text','Text'],['accent','Accent & dates']];
This means I don't have to hard-code seven separate color controls. I generate them in a loop, and updating a custom property on :root immediately changes all the elements that use it.
5. A Colorful Gradient and the Timeline's Layer Structure
I wanted the main axis to be visually clear without overpowering the cards. I designed a strip with rounded ends, a purple-to-turquoise gradient, and a soft glow.
#wrap{position:relative;overflow-x:auto;overflow-y:hidden;padding-bottom:40px}
#stage{position:relative}
#bar{position:absolute;border-radius:99px;z-index:1;box-shadow:0 0 28px color-mix(in srgb,var(--bar1) 60%,transparent)}
#bar.v{background:linear-gradient(to bottom,var(--bar1),var(--bar2))}
#bar.h{background:linear-gradient(to right,var(--bar1),var(--bar2))}
svg#lines{position:absolute;left:0;top:0;z-index:2;pointer-events:none;overflow:visible}
svg#lines path{fill:none;stroke:var(--line);stroke-width:2.5;stroke-linecap:round;filter:drop-shadow(0 0 4px var(--line))}
svg#lines circle{fill:var(--line)}
.node{position:absolute;z-index:3;width:30px;height:30px;margin:-15px 0 0 -15px;border-radius:50%;background:var(--bg);border:4px solid var(--accent);display:grid;place-items:center;font-size:11px;font-weight:800;box-shadow:0 0 0 5px color-mix(in srgb,var(--accent) 25%,transparent)}
In vertical mode, I assign the .v class to the bar; in horizontal mode, I use .h. The gradient changes direction accordingly: to bottom or to right.
I also assigned distinct z-index layers. The axis occupies layer 1, the SVG connectors layer 2, the numbered markers layer 3, and the cards layer 4. With this stacking order, lines don't obscure the event details, and the cards remain in the foreground.
The #wrap container uses overflow-x: auto. I don't try to squeeze the entire horizontal timeline into a small screen. If the number of milestones requires more room, I let visitors scroll sideways.
6. How I Made the Cards Look Like Clouds
The irregular white cards are the most recognizable part of this project. I didn't use PNG files or premade cloud-shaped SVG images. Instead, I combined an HTML element, an unusual border-radius, and several extra circles.
.card{position:absolute;z-index:4;display:flex;align-items:center;gap:14px;padding:16px 22px 16px 16px;background:var(--card);color:var(--text);border-radius:46px 54px 50px 58px/50px 46px 56px 48px;filter:drop-shadow(0 10px 18px rgba(0,0,0,.35));animation:pop .5s both}
.puff{position:absolute;z-index:-1;background:var(--card);border-radius:50%;pointer-events:none}
.card.rev{flex-direction:row-reverse;text-align:right;padding:16px 16px 16px 22px}
.ph{flex:none;width:62px;height:62px;border-radius:50%;border:3px solid var(--accent);object-fit:cover;display:block;cursor:pointer;transition:transform .2s}
.ph:hover{transform:scale(1.08) rotate(-4deg)}
.card h3{margin:0;font-size:15px;font-weight:800;line-height:1.2}
.card .d{font-size:12px;font-weight:800;color:var(--accent);margin:2px 0 4px}
.card p{margin:0;font-size:12.5px;line-height:1.4;opacity:.78}
@keyframes pop{from{opacity:0;transform:scale(.85)}to{opacity:1;transform:none}}
@media (prefers-reduced-motion:reduce){.card{animation:none}}
The foundation is .card. I gave it a light background, padding, heavily rounded corners, and a shadow. Instead of relying on a single radius, I used eight different border-radius values. This alone makes the original rectangle noticeably less regular.
Elements with the .puff class are small circles positioned absolutely. They extend beyond the card's edges, creating the silhouette of a billowing cloud. The circular .ph image has an accent-colored border and a subtle hover animation.
The cards also appear with a brief pop animation. If a visitor has requested reduced motion, I disable this entrance effect through prefers-reduced-motion.
7. Generating Cloud Shapes with JavaScript
CSS alone wouldn't have been enough if I wanted the individual cards to look different from one another. So I wrote a cloud() function that adds a varying number of circles and randomizes their sizes and positions.
function rng(a){return()=>{a|=0;a=a+0x6D2B79F5|0;let t=Math.imul(a^a>>>15,1|a);t=t+Math.imul(t^t>>>7,61|t)^t;return((t^t>>>14)>>>0)/4294967296}}
function cloud(c,w,h,seed){
  const R=rng(seed),r=(a,b)=>a+R()*(b-a);
  const add=(cx,cy,rad)=>{const p=document.createElement('i');p.className='puff';p.style.cssText=`left:${cx-rad}px;top:${cy-rad}px;width:${rad*2}px;height:${rad*2}px`;c.appendChild(p)};
  const q=()=>r(36,60)+'px';
  c.style.borderRadius=`${q()} ${q()} ${q()} ${q()}/${q()} ${q()} ${q()} ${q()}`;
  const nt=Math.round(r(3,5.4));
  for(let i=0;i<nt;i++){const f=(i+.5+r(-.3,.3))/nt,s=.55+.45*Math.sin(Math.PI*f);add(w*(.06+.88*f),r(2,12),r(15,32)*s+4)}
  const nb=Math.round(r(2,3.4));
  for(let i=0;i<nb;i++){const f=(i+.5+r(-.3,.3))/nb;add(w*(.1+.8*f),h-r(2,10),r(12,22))}
  [0,1].forEach(side=>{if(R()<.75){const y=h*(R()<.5?r(.2,.35):r(.65,.8));add(side?w-r(3,9):r(3,9),y,r(12,20))}});
}
I generally generate between three and five larger protrusions along the top edge and between two and three along the bottom. Some cards also receive extra circles on the sides. I partially vary the size of each circle according to its location so that the outlines don't form a monotonous repeating pattern.
Why I Used a Seeded Random Number Generator
At the beginning of the function, I call rng(seed). This is a deterministic pseudorandom number generator: the same seed produces the same sequence of values.
That choice matters in practice. When I recalculate the layout after a window resize or switch the timeline's orientation, each cloud keeps its distinctive shape instead of randomly changing whenever the layout is rebuilt.
Only the Shuffle clouds button assigns new seeds to the events. That is when I deliberately generate a new set of outlines.
8. Event Data: One Array Instead of Manually Writing Every Card
I stored the demo content in the EV array. Each object has four essential properties: t for the title, d for the date, p for the description, and img for the photo source.
The original file contains six events, with photos encoded as Base64. I deliberately left those image strings out of the tutorial because they occupy much of the file without explaining any timeline logic.
If I wanted to add another milestone, I would simply append a new object to the array. For example:
const newEvent = {
  t: 'New Project',
  d: 'October 2026',
  p: 'A description of another important project milestone.',
  img: 'images/project.jpg'
};

EV.push(newEvent);
render();
This is an extension example, not code copied verbatim from the demo. The component will generate a card, marker, and connector from the new data, although with many added events I would also review spacing and total timeline length.
Why I Didn't Use the Dates to Calculate Spacing
In my implementation, milestones have visually equal spacing. I don't position them proportionally to the actual number of months or years between dates. My timeline is designed to tell a story step by step, rather than to display an exact chronological scale.
That distinction matters. To show actual time intervals, I would need to introduce date parsing and a different position-calculation algorithm.
9. Wavy SVG Connectors: Mathematics Instead of an Animated Image
The core of the connecting-line effect is the wave() function. It receives the start and end coordinates, wave amplitude, a direction multiplier, and the current animation phase.
function wave(x1,y1,x2,y2,amp,sgn,ph){
  const dx=x2-x1,dy=y2-y1,L=Math.hypot(dx,dy)||1,nx=-dy/L,ny=dx/L;let d='';
  for(let i=0;i<=60;i++){const t=i/60,o=sgn*amp*Math.sin(t*Math.PI*3-ph)*Math.sin(t*Math.PI)*1.6;
    d+=(i?'L':'M')+(x1+dx*t+nx*o).toFixed(1)+' '+(y1+dy*t+ny*o).toFixed(1)}
  return d;
}
First, I calculate the vector from point A to point B. Then I find its perpendicular vector, (-dy/L, dx/L). That lets me displace intermediate points sideways regardless of whether the connector runs left, right, upward, or downward.
I divide the path into 60 segments, or 61 points. For each point, I calculate an offset:
const offset = direction * amplitude
  * Math.sin(t * Math.PI * 3 - phase)
  * Math.sin(t * Math.PI) * 1.6;
This is simply a more readable version of the equation written on one line in my original script.
The first sine function creates the moving wave pattern. The second reduces the displacement to zero at both endpoints, since sin(0) and sin(π) are zero. As a result, the line never detaches from the timeline marker or the card, even when its middle section undulates dramatically.
Finally, I assemble the coordinates into the SVG path's d attribute: the first point uses M, and subsequent points use L. There's no need to animate a transform on the entire SVG; I only update the shape of the path.
10. The render() Function: A Layout Based on Actual Screen Dimensions
My main render() function removes old cards and markers, clears the SVG, and then recalculates the timeline geometry from scratch. I call it on initial load, after switching orientations, when changing photos, when reshuffling clouds, and after window resizes.
function render(){
  stage.querySelectorAll('.card,.node').forEach(n=>n.remove());
  svg.innerHTML='';
  const n=EV.length,W=wrap.clientWidth,V=S.o==='v',LEN=V?120:110;
  const narrow=V&&W<700;
  const cardW=V?(narrow?Math.min(W-100,340):Math.min(340,W/2-LEN-24)):260;
  const cards=EV.map((e,i)=>{
    const c=document.createElement('div');
    const left=V&&!narrow&&i%2===1;
    c.className='card'+(left?' rev':'');c.style.width=cardW+'px';c.style.animationDelay=(i*90)+'ms';
    c.innerHTML=`<img class="ph" tabindex="0" alt="${e.t}" title="Change photo" src="/${e.img}"><div><h3>${e.t}</h3><div class="d">${e.d}</div><p>${e.p}</p></div>`;
    const p=c.querySelector('.ph');
    const pick=()=>{target=i;$('#file').click()};
    p.onclick=pick;p.onkeydown=k=>{if(k.key==='Enter'||k.key===' '){k.preventDefault();pick()}};
    stage.appendChild(c);cloud(c,cardW,c.offsetHeight,e.seed);return c;
  });
Here I create a card for every event, set its width, content order, and staggered entrance delay. I then read its actual height with offsetHeight. Only after measuring the rendered cards can I calculate spacing that should prevent neighboring items from overlapping.
At this stage, I use innerHTML because the demo data is predefined in the code. If I were loading titles or descriptions from user submissions or an external API, I would replace interpolation of untrusted strings with safe DOM creation and textContent.
11. Vertical Layout: Alternating Cards and a Mobile Version
In vertical mode, I place the central axis approximately in the middle of the scene. Successive cards alternate between its right and left sides. I derive the spacing between events from the tallest card.
  const maxH=Math.max(...cards.map(c=>c.offsetHeight));
  let SW,SH,axis,pos;
  if(V){
    const gap=Math.max(maxH+30,170),top=70;
    SW=W;SH=top*2+(n-1)*gap;axis=narrow?34:W/2;
    pos=i=>({x:axis,y:top+i*gap});
    bar.className='v';Object.assign(bar.style,{left:axis-7+'px',top:'24px',width:'14px',height:SH-48+'px'});
The gap and top variables establish the spacing and outer margins. For narrow screens, I check whether W < 700 and move the axis to 34px from the left edge.
I then calculate positions for the individual cards:
  EV.forEach((e,i)=>{
    const p=pos(i),c=cards[i],h=c.offsetHeight,sgn=i%2?1:-1;
    const nd=document.createElement('div');nd.className='node';nd.textContent=i+1;nd.style.left=p.x+'px';nd.style.top=p.y+'px';stage.appendChild(nd);
    let ex,ey;
    if(V){
      const right=narrow||i%2===0,off=i%2?-26:26;
      ey=p.y+off;ex=right?p.x+LEN:p.x-LEN;
      c.style.left=(right?ex:ex-cardW)+'px';c.style.top=(ey-h/2)+'px';
    }else{
On desktop, I alternate the cards on either side of the axis. On mobile, I place all of them on the right to avoid creating two very narrow columns.
I also account for the fact that each connector should end at the edge of the card, not its center. I therefore calculate separate ex and ey coordinates, which I later pass to the SVG path generator.
12. Horizontal Layout: A Scrollable Story Above and Below the Axis
For the horizontal orientation, I don't simply rotate the existing vertical layout with CSS. I recalculate the scene dimensions and the positions of all milestones.
  }else{
    const gap=250,pad=170;
    SW=Math.max(W,pad*2+(n-1)*gap);SH=2*(LEN+maxH+50);axis=SH/2;
    pos=i=>({x:pad+i*gap,y:axis});
    bar.className='h';Object.assign(bar.style,{left:'24px',top:axis-7+'px',height:'14px',width:SW-48+'px'});
  }
  stage.style.width=SW+'px';stage.style.height=SH+'px';svg.setAttribute('width',SW);svg.setAttribute('height',SH);
I set a 250px interval between successive points and 170px of padding at either end. The scene is never narrower than its container, but it can extend beyond that width when more events are present.
I position cards alternately above and below the axis:
    }else{
      const up=i%2===0,off=i%2?-34:34;
      ex=p.x+off;ey=up?p.y-LEN:p.y+LEN;
      c.style.left=(ex-cardW/2)+'px';c.style.top=(up?ey-h:ey)+'px';
      ex=p.x+off;
    }
    const pa=document.createElementNS(NS,'path'),ci=document.createElementNS(NS,'circle');ci.setAttribute('r',4.5);
    svg.append(pa,ci);ITEMS.push({p,ex,ey,c,sgn,i,pa,ci});
  });
  frame(performance.now());
  if(!V)wrap.scrollLeft=0;
}
The key is the overflow-x: auto property on #wrap. Rather than compressing all the cards into the viewport, I allow visitors to scroll along the horizontal story. This helps keep even a longer timeline readable.
13. The Animation Loop: Clouds Drift and SVG Connectors Follow Them
Once all the elements exist, I run an animation loop using requestAnimationFrame(). I continuously update the cards' offsets and the endpoints of their wavy connector paths.
function frame(now){
  const t=(now-T0)/1000;PH+=Math.max(0,Math.min((now-LAST)/1000,.1))*S.speed*2.2;LAST=now;
  for(const it of ITEMS){
    const k=it.i*1.7,dx=S.drift*Math.sin(t*.55+k),dy=S.drift*.8*Math.cos(t*.42+k*1.3);
    it.c.style.translate=dx.toFixed(1)+'px '+dy.toFixed(1)+'px';
    const x2=it.ex+dx,y2=it.ey+dy;
    it.pa.setAttribute('d',wave(it.p.x,it.p.y,x2,y2,S.amp,it.sgn,PH+it.i));
    it.ci.setAttribute('cx',x2);it.ci.setAttribute('cy',y2);
  }
}
On each frame, I calculate small dx and dy offsets using sine and cosine. Their values depend on elapsed time, event index, and the S.drift setting.
I move the cloud using the CSS translate property, leaving its base left and top positions unchanged.
I then move the connector endpoint by the exact same dx and dy offsets. I generate a fresh wave through wave() and update the small SVG endpoint circle to match.
This is the detail that makes the animation convincing: I don't move the cards alone. I move the ends of their connecting lines as well, so the entire structure behaves like one interconnected system.
Wave Speed and Cloud Drift Are Different Settings
It's important to separate two controls. S.speed advances the phase PH, so it changes how quickly the line itself undulates. S.drift controls how far each card moves from its base position. The drift frequencies are defined directly in frame() by the time multipliers .55 and .42; the Wave speed slider doesn't change them.
This lets me freeze the shape of the wave while keeping the clouds gently moving, or do the opposite: set drift to zero and watch connectors ripple between stationary cards and the axis.
14. Customization Panel: Colors, Waves, and Cloud Randomization
I wanted the demonstration to be adjustable without manually editing CSS every time. That's why I created a collapsible control panel in the top-right corner.
#panel{position:fixed;z-index:20;right:12px;top:calc(12px + env(safe-area-inset-top,0px));width:236px;background:rgba(20,22,48,.92);backdrop-filter:blur(10px);border:1px solid rgba(255,255,255,.14);border-radius:18px;color:#fff;box-shadow:0 12px 30px rgba(0,0,0,.4)}
#panel header{display:flex;justify-content:space-between;align-items:center;padding:10px 14px;font-weight:800;font-size:14px;cursor:pointer}
#panel .body{padding:2px 14px 14px;display:grid;gap:9px}
#panel.closed .body{display:none}
.row{display:flex;justify-content:space-between;align-items:center;font-size:13px;gap:8px}
.row input[type=color]{width:38px;height:26px;border:2px solid rgba(255,255,255,.3);border-radius:8px;padding:0;background:none;cursor:pointer}
.row input[type=range]{width:110px;accent-color:#7c5cff}
.seg{display:grid;grid-template-columns:1fr 1fr;background:rgba(255,255,255,.08);border-radius:10px;padding:3px}
.seg button{border:0;background:none;color:#fff;font:inherit;font-size:13px;font-weight:600;padding:6px;border-radius:8px;cursor:pointer}
.seg button.on{background:linear-gradient(135deg,var(--bar1),var(--bar2));color:#0d0f24;font-weight:800}
#reset,#shuf{border:1px solid rgba(255,255,255,.25);background:none;color:#fff;border-radius:10px;padding:6px;font:inherit;font-size:12.5px;cursor:pointer}
button:focus-visible,input:focus-visible,.ph:focus-visible{outline:2px solid #18d6c8;outline-offset:2px}
The essential panel logic sits near the end of my script:
// settings panel
const cb=$('#colors');
LABELS.forEach(([k,l])=>{
  const r=document.createElement('label');r.className='row';
  r.innerHTML=`<span>${l}</span><input type="color" data-k="${k}" value="${DEF[k]}">`;cb.appendChild(r);
});
function setColor(k,v){root.style.setProperty('--'+k,v)}
cb.addEventListener('input',e=>{const k=e.target.dataset.k;if(k)setColor(k,e.target.value)});
$('#shuf').onclick=()=>{EV.forEach(e=>e.seed=Math.random()*1e9|0);render()};
$('#reset').onclick=()=>{cb.querySelectorAll('input').forEach(i=>{i.value=DEF[i.dataset.k];setColor(i.dataset.k,i.value)})};
$('#amp').oninput=e=>{S.amp=+e.target.value};
$('#speed').oninput=e=>{S.speed=+e.target.value};
$('#drift').oninput=e=>{S.drift=+e.target.value};
$('#speed').value=S.speed;$('#drift').value=S.drift;
$('#seg').onclick=e=>{const o=e.target.dataset.o;if(!o)return;S.o=o;
  document.querySelectorAll('#seg button').forEach(b=>b.classList.toggle('on',b.dataset.o===o));render()};
$('#ph').onclick=()=>{const p=$('#panel');p.classList.toggle('closed');$('#chev').textContent=p.classList.contains('closed')?'▸':'▾'};
I generate seven color inputs from LABELS. When a value changes, I call root.style.setProperty('--'+k,v). The browser then updates every element that uses that CSS custom property.
The three sliders serve different purposes: Wave height modifies S.amp; Wave speed controls S.speed; and Cloud drift adjusts S.drift.
I also added Shuffle clouds, which generates new rng() seeds for each event and calls render(). Reset colors, meanwhile, restores only the palette stored in DEF — it doesn't reset the timeline orientation, photos, or slider settings.
The orientation buttons switch S.o between v and h. Every time the orientation changes, I call render() so that all coordinates are calculated for the new arrangement.
15. Replacing Event Photos by Clicking a Thumbnail
I also made it possible to replace the image in any event. Clicking a thumbnail opens the browser's file picker. I used FileReader and readAsDataURL() to process the chosen file.
$('#file').onchange=e=>{
  const f=e.target.files[0];if(!f)return;const r=new FileReader();
  r.onload=()=>{EV[target].img=r.result;render()};r.readAsDataURL(f);e.target.value='';
};
After reading the file, I store its data: representation in EV[target].img and render the timeline again. The new picture then appears immediately in the correct cloud card.
The demo photos in the original file are likewise stored as data:image/jpeg;base64,... strings. That's why I can package all sample photos inside a single HTML file.
One limitation is important: replacing a photo doesn't save it to a database or upload it to a server. Refreshing the page restores the original data. Permanent storage would require an additional mechanism for files and metadata.
16. Responsive Design, Accessibility, and Reduced Motion Preferences
I didn't rely on media queries alone for responsiveness. The main behavior depends on the current width of #wrap and is calculated inside render().
For a vertical timeline narrower than 700px, I shift the axis and place all the cards on one side. On smaller screens, I also collapse the options panel by default.
let rt;window.addEventListener('resize',()=>{clearTimeout(rt);rt=setTimeout(render,120)});
if(window.innerWidth<700)$('#panel').classList.add('closed');
render();
requestAnimationFrame(function loop(n){frame(n);requestAnimationFrame(loop)});
When a resize event occurs, I don't rebuild everything immediately for every tiny size change. I use a 120ms delay to limit how often the complete layout is recalculated.
I also accounted for prefers-reduced-motion. In reduced-motion mode, I initialize both wave speed and cloud drift to zero and disable the cards' entrance animation.
const RM=matchMedia('(prefers-reduced-motion:reduce)').matches;const S={o:'v',amp:7,drift:RM?0:10,speed:RM?0:.5};
const $=s=>document.querySelector(s),root=document.documentElement;
const stage=$('#stage'),svg=$('#lines'),bar=$('#bar'),wrap=$('#wrap');
let target=0,ITEMS=[],T0=performance.now(),LAST=T0,PH=0;const NS='http://www.w3.org/2000/svg';EV.forEach(e=>e.seed=Math.random()*1e9|0);
The event photos can also be activated using Enter or Space. In the current demo, they are images with tabindex="0"; in a production version, I would prefer to place each photo inside a real button with a meaningful accessible label so that its action is more obvious to assistive technologies.
17. Performance: What Actually Costs Time in This Animation?
This project doesn't use WebGL. Every card is a DOM element, and every connecting line is an SVG object. That means the text remains normal HTML content, and the component is straightforward to style and embed on a conventional website.
Most of the work happens in two places. render() creates and measures elements, then computes their positions. I only run it when something requires a full layout rebuild: orientation changes, new photos, or other relevant settings. frame(), on the other hand, runs every frame: it updates card transforms and rebuilds each connector path from 61 points.
With six events, this approach is straightforward to maintain. If I were building a timeline with dozens or hundreds of milestones, I would consider several optimizations: fewer points per SVG path, animating only while the component is visible, pausing the loop when effects are disabled, and avoiding a complete card rebuild when only one image changes.
With a larger number of entries, I would also revisit the mobile layout. The current Math.min(W-100,340) formula assumes a reasonably sized viewport; within extremely narrow embedded containers, it would need an additional minimum-width safeguard.
18. How I Would Use This Timeline on a Real Website
The most obvious application for me is a company history. The timeline could show when a brand was founded, when its first clients arrived, how the team grew, which products launched, and what happened next. Photos make it more than a list of dates.
I could just as easily use it for project milestones: from the brief and initial sketches, through the prototype, to implementation and launch. On an interactive agency's site, it could tell the story of how a website or application was developed.
I can also see applications in portfolios, product histories, campaign schedules, and visualizations of project stages. One thing to remember is that the current component places events at equal intervals, regardless of how much time actually passed between their dates.
For integration into Joomla, WordPress, or a custom CMS, I would move the EV array into server-generated data or JSON, put the CSS into a separate stylesheet, and keep render(), cloud(), and wave() in a JavaScript module. Since the current code uses global selectors such as #stage, #wrap, and #panel, I would first encapsulate it as a component instance before placing multiple timelines on the same page.
19. Download


20. Conclusion: A Moving Timeline Made from Real HTML and SVG Elements
In this experiment, I wasn't trying to replace a traditional timeline with an elaborate video. I wanted a real HTML component that retained readable text, photographs, and interactive controls while looking far more interesting than an ordinary list of milestones.
The most interesting part turned out to be the combination of three mechanisms: deterministically generated cloud outlines, layout calculations based on the cards' actual dimensions, and animated SVG connectors whose endpoints follow moving elements.
The result is a timeline that can tell a story vertically or horizontally, change its color palette without rewriting styles, and let me experiment with motion without rebuilding the entire page. HTML provides the content, CSS gives it a visual identity, SVG draws the connections, and JavaScript brings everything together into one animation.

Paweł Nosko
Paweł Nosko — a developer and founder of Design Cart, active in the IT industry since 2009 and focused on e-commerce since 2011. He specializes in building online stores and advanced product configurators. He has delivered over 100 projects, working with platforms such as OpenCart, PrestaShop, Magento, and WooCommerce. He combines technical expertise with a business mindset — his solutions don’t just work, they sell. On his blog, he shares practical insights, tests, and analysis of e-commerce tools — no theory, just real experience.